How to Build a Startup Financial Model That Investors Actually Trust
Category: Finance | Slug: startup-financial-model-investors-trust | Read time: 12 min
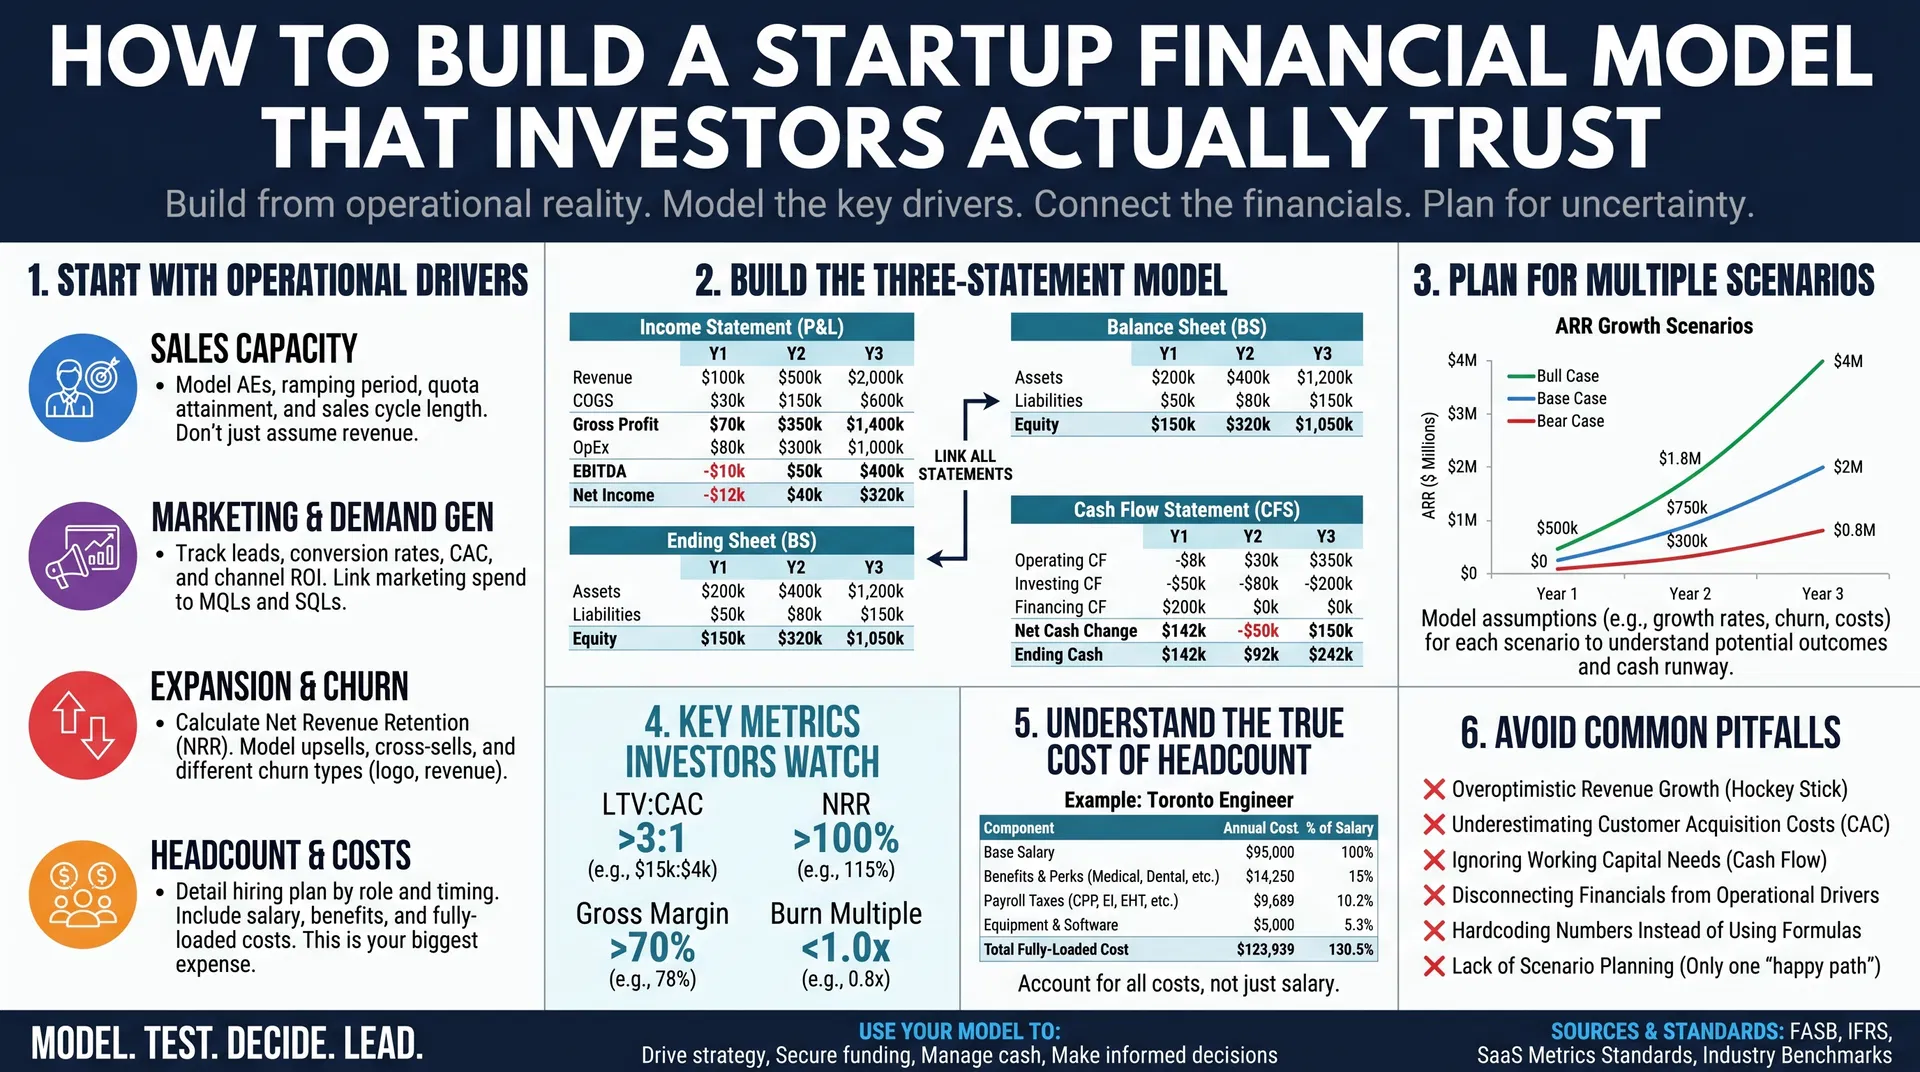
Most startup financial models fail before they reach a single investor. Not because the numbers are wrong — but because they are built backwards. A model that starts with TAM and works down to revenue is an expression of optimism dressed up as analysis. Investors see it immediately.
The models that hold up under scrutiny start from the bottom: with sales reps, their quotas, their ramp time, and the marketing engine feeding their pipeline. Every assumption is explicit, every driver is operational, and every scenario is honest about what the business does not yet know. A model built this way is wrong in ways you can see, track, and fix. A model built the other way is wrong in ways you only discover at the worst possible moment.
This guide walks through how to build that kind of model — the components investors expect, the mistakes that quietly undermine credibility, and how a CFO uses the model as a management tool, not just a fundraising artifact.
Why Most Startup Financial Models Fail
The "Top-Down" Fallacy: Arithmetic of Hope, Not Strategy
The most common failure in early-stage modelling is the top-down approach. It usually looks like this: "Our TAM is $10 billion. If we capture just 1% of that market, we will hit $100 million in ARR within five years." Mathematically, that is correct. As a financial model, it is useless.
It tells you nothing about how the company generates revenue, what it costs to grow, or whether the team has any grasp of how their business actually works. A TAM exercise is a fine starting point for a board discussion — it is a dangerous foundation for a model. Investors who know SaaS unit economics will spot it as a placeholder in the first five minutes, and it tends to colour everything else they read after that.
Operational Disconnect: Technically Correct, Strategically Flawed
The second failure mode is a spreadsheet that calculates correctly but has no connection to how the business runs. A model that projects $5 million in ARR by Year 3 without specifying how many sales reps are needed, what their individual quotas are, how long they take to ramp, and what the average sales cycle looks like — that model has an output but no argument. It cannot be pressure-tested, and it cannot be used to make a hiring or spending decision.
Slack's S-1 filing illustrates what the opposite looks like. It contained detailed cohort data, paid customer counts, ARPU breakdowns, and conversion metrics from free to paid — giving investors the operational inputs to build their own view of the business rather than simply taking the headline numbers at face value. A model that only shows the output, without the machinery underneath, fails the same test.
False Precision: The Illusion of Certainty
A model that projects revenue to the nearest dollar five years out, or chains together fifty interdependent assumptions, does not signal rigour — it signals that the founder does not understand how uncertain early-stage businesses are. Experienced investors know that kind of precision is invented, and it tends to make them trust the simpler numbers less too.
Ten well-chosen, clearly documented assumptions with sensitivity analysis around the variables that actually move the needle is more credible than fifty. The goal is not to account for everything. It is to show you know which assumptions matter and what happens when they are wrong.
The Bottom-Up Modelling Approach: Building from Operational Reality
A bottom-up model starts with the actual drivers of the business and builds from there to an income statement, balance sheet, and cash flow. For a B2B SaaS company, those drivers fall into four models that need to work together.
Sales Capacity Model: The Engine of New ARR
The sales capacity model answers one question: how much new ARR can your current team actually close? It starts with headcount — fully ramped account executives, their individual quotas, how long it takes a new hire to reach full productivity, and the length of a typical sales cycle. The output is new ARR by period, grounded in what the team can realistically produce.
Consider a SaaS company with 5 fully ramped AEs, each carrying a $300,000 annual quota, planning to hire 2 new AEs per quarter with a 6-month ramp at 50% productivity:
| Quarter | Ramped AEs | Ramping AEs | New ARR |
|---|---|---|---|
| Q1 | 5 × $300K = $1,500K | 2 × $150K = $300K | $1,800,000 |
| Q2 | 5 × $300K = $1,500K | Q1 hires $300K + Q2 hires $300K | $2,100,000 |
| Q3 | 5 × $300K + Q1 fully ramped $600K = $2,100K | Q2 $300K + Q3 $300K = $600K | $2,700,000 |
Notice what this forces you to confront: new ARR does not scale instantly when you hire. Ramp periods create a lag between headcount spend and revenue contribution that a linear growth assumption will completely miss.
Marketing and Demand Generation Model
The demand generation model connects marketing spend to pipeline, and pipeline to closed revenue. When monthly lead volume, lead-to-opportunity conversion rate, and opportunity-to-close rate are all explicit and tracked, the model can answer a question that matters enormously to a board: if we invest an additional $X in content or paid acquisition, how much new ARR does that produce, and over what timeframe? Without this model, marketing spend is a cost centre. With it, it becomes an investment with a measurable return. For a detailed framework on tracking these metrics, see our guide on growth and pipeline KPIs.
Expansion and Churn Model
For most SaaS businesses past the early stages, existing customers are a more efficient source of revenue growth than new acquisition — expansion is cheaper to generate, and churned revenue costs more to replace than it looks on a monthly basis.
The model tracks three things: expansion rate (upsells and seat growth), churn rate (cancelled contracts), and contraction rate (downgrades). Even small movements in churn have outsized effects on long-run revenue. A business with 2% monthly churn has a dramatically different valuation trajectory than one at 1%, even if every other metric is identical. The battle for profitability in SaaS is often won or lost here, not in new logo acquisition. For a complete framework on measuring and managing these metrics, see our guide on SaaS sustainability and retention KPIs.
Headcount Model: The Primary Cost Driver
The headcount model is the most important cost component for almost any SaaS company. Personnel typically represents 60–80% of operating expenditure, and it is the area where models most commonly undercount.
The mistake is using base salary as a proxy for cost. The real number is typically 20–30% higher once employer payroll taxes, benefits, and overhead are included. For a Canadian company, the gap is significant enough to shift runway calculations materially.
Worked Example — Fully-Loaded Headcount Cost: Canada vs. United States (2025)
The table below compares the fully-loaded cost of a software engineer at a $100,000 base salary in two common startup jurisdictions. The structure is the same in both cases; the rates and labels differ.
| Line Item | Canada (Toronto, CAD) | United States (e.g., California, USD) | Notes |
|---|---|---|---|
| Base Salary | $100,000.00 | $100,000.00 | — |
| Employer Pension / Social Security | $4,034.10 (CPP) + $396.00 (CPP2) | $6,200.00 (Social Security) | CA: 5.95% up to YMPE $71,300 + 4.0% on $71,300–$81,200. US: 6.2% up to $176,100 wage base |
| Employer EI / Medicare | $1,508.47 (EI) | $1,450.00 (Medicare) | CA: 1.4× employee rate on max insurable earnings $65,700. US: 1.45% of all wages, no cap |
| Federal Unemployment (FUTA) | N/A | $42.00 | US: effective 0.6% on first $7,000 after standard 5.4% state credit |
| Provincial / State Payroll Tax | $0 (Ontario EHT — exempt below $1M threshold) | ~$350–$800 (SUTA — varies by state and rate) | CA: EHT at 1.95% on payroll above $1M. US: SUTA rate and wage base vary significantly by state |
| Health Benefits | $5,000.00 | $8,000.00–$12,000.00 | US employer health contribution is typically higher due to absence of public coverage |
| Other Benefits | $3,000.00 | $3,000.00–$5,000.00 | RRSP/401(k) matching, wellness, etc. |
| Overhead Allocation | $10,000.00 | $10,000.00 | Office, equipment, software licences |
| Total Fully-Loaded Cost (est.) | ~$123,939 CAD | ~$129,000–$135,000 USD | 23–35% above base salary depending on state and benefits package |
Canada — regulatory disclosure: CPP, CPP2, and EI rates above reflect 2025 federal rates. Provincial payroll taxes (Ontario EHT, Quebec HSPT, Manitoba HE Levy, etc.) vary by province and payroll threshold. Always confirm current-year rates and thresholds with the CRA Payroll Deductions Tables (T4032) before incorporating figures into a live financial model.
United States — regulatory disclosure: Social Security, Medicare, and FUTA rates above reflect 2025 federal rates. State unemployment (SUTA) rates, wage bases, and any applicable state payroll taxes (e.g., California SDI, New York MCTMT) vary significantly by state and employer experience rating. Always confirm current-year federal and state/provincial obligations with the IRS Employer's Tax Guide — Publication 15 (Circular E) and your state's labour department before incorporating figures into a live financial model.
Free Template: The Startup Budget & Runway Template — Starter puts everything in this section into a ready-to-use Excel file. Enter your assumptions once and it auto-calculates a full 12-month P&L, monthly burn rate, and ending cash balance. Download free from the Resources Hub →
The Three-Statement Model: The Gold Standard
Once a company moves past early-stage fundraising, investors and auditors expect a fully linked three-statement model: income statement, balance sheet, and cash flow statement. The value is not in having all three — it is in having them connected. A change in revenue hits the income statement, flows through to retained earnings on the balance sheet, and lands in operating cash flow. If those links do not hold, the model is not a model — it is three separate spreadsheets.
The Income Statement (Profit & Loss)
The income statement should separate recurring revenue (MRR/ARR) from any non-recurring items, show cost of goods sold distinctly from operating expenses, and break operating expenses into their functional categories: Sales & Marketing, R&D, and G&A. For SaaS, gross margin is the health indicator — it reflects the scalability of the underlying architecture and support model. A declining gross margin is not a minor variance; it needs an explanation before it reaches the board. For a deeper treatment of the income statement and how it connects to the other two statements, see our guide on understanding financial statements.
The Balance Sheet
Three balance sheet items deserve close attention for early-stage SaaS. Cash and equivalents sets the runway clock. Deferred revenue — a liability representing subscription payments received but not yet recognised — is one of the most useful forward indicators available. And any debt needs to be modelled alongside its covenants, because a covenant breach does not announce itself in the income statement.
Atlassian's FY2023 balance sheet illustrates why deferred revenue matters. The company closed that year with approximately $1.55 billion in total deferred revenue — $1.36 billion current and $183 million non-current — up 31% year-over-year, driven by growth in annual and multi-year subscriptions. That growth in deferred revenue is visible evidence of customer commitment before a dollar of it is recognised as revenue. Investors use it to build conviction about forward performance in a way the income statement alone does not allow.
The Cash Flow Statement
The cash flow statement is arguably the most important of the three for a growth-stage CFO. It reconciles net income with actual cash movement, removing the timing distortions that come with accrual accounting. A company can show a profit on the income statement while running out of cash — and the cash flow statement is where that divergence becomes visible. Runway lives here. So does the signal that it is time to raise. For a practical operational tool that works alongside the three-statement model, see our guide on the 13-week cash flow forecast.
Revenue Recognition: ASC 606 and IFRS 15
Revenue recognition is where SaaS CFOs regularly get caught off guard, particularly at companies operating across borders. Both ASC 606 (US GAAP) and IFRS 15 require revenue to be recognised when performance obligations are satisfied — for a subscription business, that means over the subscription term, not at the point of payment. Upfront annual or multi-year contract payments sit on the balance sheet as deferred revenue until they are earned period by period.
For Canadian companies, the choice of accounting framework is a decision that needs to be made before fundraising begins, not during it. CCPCs reporting under ASPE have different recognition options than companies seeking US institutional capital or preparing for a public listing. A founder who sets up under ASPE and then begins conversations with US growth-equity investors will face a restatement conversation at the worst possible time. Align the framework to where the company is going, not where it is today. For a full treatment of how accounting standards affect cross-border reporting, see our guide on global accounting standards for SaaS companies.
Scenario Planning: Base, Bull, and Bear
A single-point forecast is a liability. It gives the board one number to anchor on, which means any deviation reads as a miss rather than a range that was always understood to be approximate. A model with three scenarios — base, bull, and bear — is a different kind of document. It shows that management understands the range of outcomes, knows what drives each one, and has thought through how to respond.
The base case is management's plan. The bull case reflects strong execution and favourable market conditions. The bear case is the one that actually matters most — it defines the floor, the minimum runway under adverse conditions, and whether the company has room to manoeuvre if things go sideways.
When bear case probability rises, the CFO's job is to arrive at the board with options, not just the problem. What can be cut without damaging the growth trajectory? How much runway does each scenario buy? What is the trigger point for initiating a new fundraise? The model should be structured so those questions can be answered quickly, not assembled under pressure. For a practical framework on managing through adverse scenarios, see our guide on navigating pre-crisis conditions as a startup.
Common Financial Modelling Mistakes
Assuming Linear Growth
SaaS businesses do not grow in straight lines, but many financial models project them as if they do. Sales reps take time to ramp. Marketing campaigns have lag before they generate pipeline. Product releases do not convert to revenue the month they ship. A model that applies the same growth rate every month ignores all of this and will be wrong in predictable ways — overestimating in months where those lag effects bite and underestimating in the months where they resolve.
Ignoring Seasonality
Many B2B SaaS businesses run hot in Q4, when budget owners are spending before year-end, and slow in Q1, when new budgets are being approved. A model that ignores this pattern will produce a Q1 that looks like a miss when it is actually a seasonal trough that the team has seen every year. Build seasonality into the model from the start — it is not a complication, it is a feature that makes the model more honest.
Forgetting Fully-Loaded Payroll Costs
Using base salary as a headcount cost is one of the most common modelling errors at early-stage companies. The combined Canada/US table above shows the real number sits 23–35% above base salary once employer contributions, benefits, and overhead are included. Across a ten-person team, the difference between salary-only and fully-loaded costs can shift burn rate by hundreds of thousands of dollars annually and compress runway by months. Build the fully-loaded figure into every headcount line from day one.
Not Modelling the Option Pool
An option pool that is not in the model is ownership that is not being accounted for. Investors will look at fully diluted share counts. If the model only shows issued shares, the cap table does not reflect what a financing round or exit will actually look like — and that gap surfaces in due diligence, not before it. Build the option pool into the cap table from the start, show the fully diluted ownership structure, and make sure the board is looking at the same picture that investors will see. For a complete guide to cap table mechanics, see our article on cap table fundamentals for founders.
Using the Model as a Management Tool
A financial model that only comes out for fundraising rounds is not doing most of its job. The real value is in using it continuously — to set the thresholds that tell you when something is wrong, when to bring a decision to the board, and when to start a fundraise before you are forced into one.
When to Escalate to the Board
The model should define escalation thresholds in advance, not after they are breached. Cash runway dropping below 12–18 months is the clearest one — that is when a fundraise process needs to start, because processes take longer than founders expect. A material move toward the bear case, an LTV:CAC ratio falling below 3:1, NRR dropping below 100%, or any metric touching a debt covenant — these belong in front of the board with options attached, not just a status update. The CFO's role in these moments is not to deliver bad news. It is to arrive with a framework: here is what is happening, here are the levers, here is what each one costs, here is the path forward.
Audit and Covenant Compliance
The audit committee will examine revenue recognition compliance against ASC 606 or IFRS 15, going concern assessments based on cash flow projections, and whether the data feeding the model has adequate controls around it. That last point matters more than it sounds — a model built on spreadsheets that anyone can edit, with no version control or input validation, is a liability during an audit and a red flag for institutional investors who ask to see supporting documentation. For a practical framework on building the internal controls that protect model integrity, see our guide on SOX-Lite internal controls for startups.
Lenders add another layer. Financial covenants tied to liquidity ratios, debt-to-equity thresholds, and EBITDA targets create hard limits that the model needs to track continuously. A covenant breach does not give advance notice — the model is how you see it coming in time to do something about it.
Further Reading & Sources
Canadian founders can use the BDC Financial Plan Template — or the BDC's Cash Flow Projection Tool for Tech Businesses, which generates SaaS-specific metrics automatically — as a structural baseline before customising for their unit economics. Companies investing in qualifying R&D should model SR&ED tax incentives through the CRA SR&ED program, which can materially reduce net R&D costs and improve cash runway projections.
Official payroll and tax references:
- CRA Payroll Deductions Tables (T4032) — Canada Revenue Agency
- IRS Employer's Tax Guide — Publication 15 (Circular E) — Internal Revenue Service